Monitoring a Web Server with Panther - Part 1 (Data Ingestion)
17 Apr 2023
.
tech
.
Comments
#security
#siem
You’re reading this post from a web server that I’ve designed with security in mind - it has a minimal attack surface with only HTTP/HTTPS and SSH ports open, and SSH access is restricted to public key authentication only. I’ve also set up automated software updates, which has let me run this server worry-free for years.
But here’s the thing: even though I don’t store valuable data on this server, a compromise could still be dangerous. Attackers could use it as a stepping stone to pivot to my personal devices that I use to manage it. That’s why I decided to implement a Security Information and Event Management (SIEM) system using Panther to automate monitoring and detection.
For example, I would never SSH to my web server through Tor or VPN - that would be a clear red flag. Other suspicious activities might include unexpected ports being opened (possibly for reverse shells) or unknown kernel modules being loaded.
Setting Up Data Ingestion
The first step was identifying what data sources I wanted to monitor and setting up a pipeline to collect and process that data. I focused on three key sources:
- Web server logs from the public-facing ports (HTTP/HTTPS)
- Authentication logs to track login attempts
-
Network port information using
netstatto monitor what’s listening
To collect and store these logs, I used Fluentd to send everything to AWS S3, then Panther pulls the data from the bucket for processing. Here’s how the setup looks:

Setting up Fluentd for the web server logs took some trial and error initially, but once I got the hang of it, I was able to configure the remaining sources in just a couple of minutes. If you’re interested in the Fluentd configuration, you can find it here.
Configuring Panther Schemas
Next, I needed to configure Panther to understand and process the different types of logs. Nginx logs were the easiest since Panther provides a Managed Schema for them. For the authentication and netstat logs, I used pantherlog to automatically infer the custom schemas needed to parse them:
./pantherlog infer --name Netstat ~/Downloads/20230416_0.json
schema: Custom.Netstat
fields:
    - name: foreign_address
      required: true
      type: string
    - name: local_address
      required: true
      type: string
    - name: name
      required: true
      type: string
    - name: process
      required: true
      type: string
    - name: protocol
      required: true
      type: string
    - name: recv
      required: true
      type: string
    - name: send
      required: true
      type: string
    - name: state
      required: true
      type: string
./pantherlog infer --name Auth ~/Downloads/20230416_25.json
schema: Custom.Auth
fields:
    - name: host
      required: true
      type: string
    - name: ident
      required: true
      type: string
    - name: message
      required: true
      type: string
    - name: pid
      required: true
      type: bigint
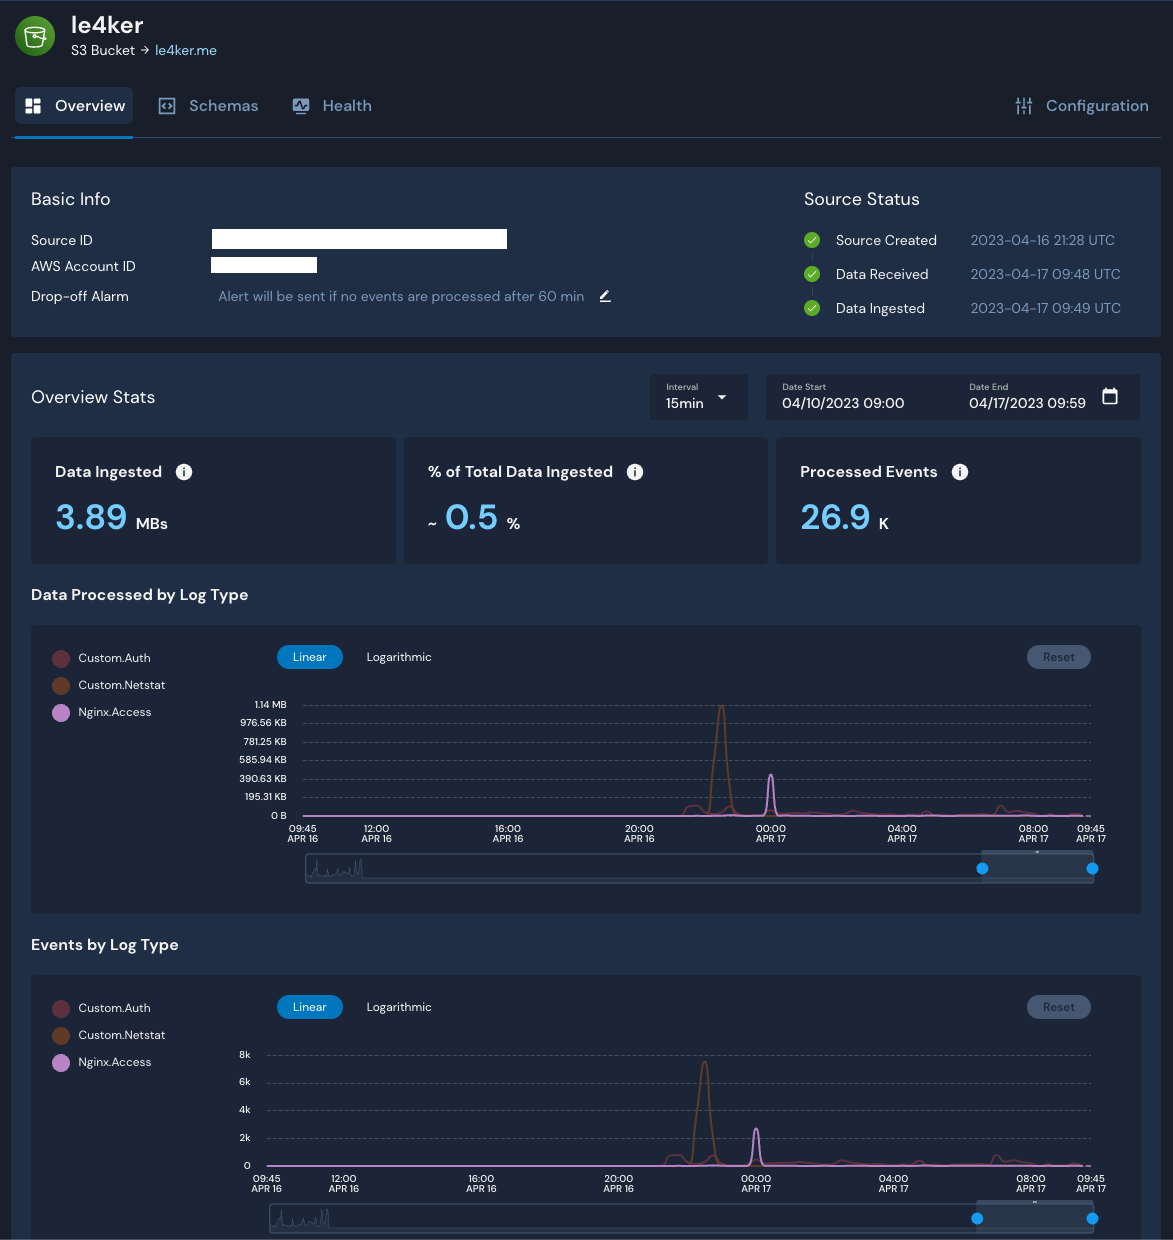
After creating the S3 Log Source, the final step was attaching the appropriate schemas to each data source’s prefix. Within minutes of completing this setup, data started flowing into Panther:
What’s Coming Next
In the following posts, I’ll cover:
- Enriching the data with Tor and VPN intelligence
- Writing detections to monitor and alert on suspicious activities
This setup gives me real-time visibility into what’s happening on my server, allowing me to detect potential compromises before they become serious issues.
Have you set up SIEM monitoring for your personal infrastructure? I’d love to hear about your approach and any lessons learned along the way!

Panos is an engineering leader at Panther, with over a decade of experience in cybersecurity and engineering leadership. His career includes security research at CERN, security engineering at Microsoft Office 365, and founding Blocktopus, a KYC/AML startup. He holds patents, has published research in security and machine learning, and has helped scale startups from pre-seed through Series B. On this blog, he writes about security, leadership, and developer productivity.